TL;DR — After deleting and recreating a dynamic route folder (e.g. [id]/edit.astro) at the same path, the dev server can keep serving a stale, completely unstyled version of the page while production builds render it correctly. No console error, no build error. It's Vite's dev-time module cache, not a code bug — rm -rf node_modules/.vite and a restart fixes it.
A page's HTML content is correct, but every element renders with zero styling — like opening a bare .html file.
No error anywhere: browser console, terminal, or build output.
A normal restart (Ctrl+C, npm run dev again) does not fix it.
This follows deleting a route folder and recreating a new file at the exact same dynamic path.
Rule out a real code bug first
Before blaming the cache, confirm the source is actually correct by comparing Astro's scoped-CSS hash between the production CSS and HTML output for that page:
grep -o "data-astro-cid-[a-z0-9]*" dist/client/_astro/page-name.*.css | head -1
grep -o "data-astro-cid-[a-z0-9]*" dist/server/chunks/page-name_*.mjs | sort -u | head -1
emdashkits.com
If both hashes match, the source and the production build are correct — the bug is purely in the dev server.
Vite's dev server keeps a persistent module-graph cache under node_modules/.vite keyed partly by file path. When a route folder is deleted and a new file is created at the exact same path, Vite can keep associating that path with the old, already-invalidated module instead of picking up the new one — including its compiled scoped styles.
Fix
Stop the dev server first (Ctrl+C) — deleting the cache while the process still holds a lock on it, especially on Windows, can crash the process or leave the deletion half-done.
Delete the cache folder: rm -rf node_modules/.vite.
Restart with npm run dev. The first start afterward is slower than usual since Vite rebuilds its dependency pre-bundle from scratch — that's expected.
When this is likely to happen again
Deleting a route folder (especially one using a dynamic segment like [id] or [slug]) and creating a new file at the same path.
Restructuring several files at once inside one route directory (renaming, moving, merging/splitting).
TL;DR — A custom session-cookie login flow appeared to succeed on localhost (the OTP verified, the response looked fine) but every subsequent request to a login-gated page treated the visitor as logged out. Identical code worked fine on the live HTTPS site. The cookie's Secure attribute was hardcoded to true — and per the cookie spec, browsers never store or send a Secure cookie over a plain, non-HTTPS connection.
Check the actual Set-Cookie response header and the browser's own cookie storage panel — on localhost over http://, the cookie is sent by the server but never actually stored by the browser.
Root cause
// before -- assumes the app is always served over HTTPS
setCookie("session", token, { secure: true, httpOnly: true });
emdashkits.com
A cookie config that quietly assumes "we're always on HTTPS" breaks the instant you test over plain HTTP, which local dev servers commonly are.
// after -- derive secure from the actual request protocol
const isHttps = request.url.startsWith("https://");
setCookie("session", token, { secure: isHttps, httpOnly: true });
emdashkits.com
Lessons learned
Any Secure-flagged cookie needs to key off the real request scheme, not an assumption baked in once at cookie-creation time.
"Works in production, silently fails in local dev" is a strong signal to check cookie flags before anything else in an auth flow.
Check other cookies in the same codebase for the same hardcoded assumption — if one cookie has this bug, sibling cookies set the same way are worth auditing too.
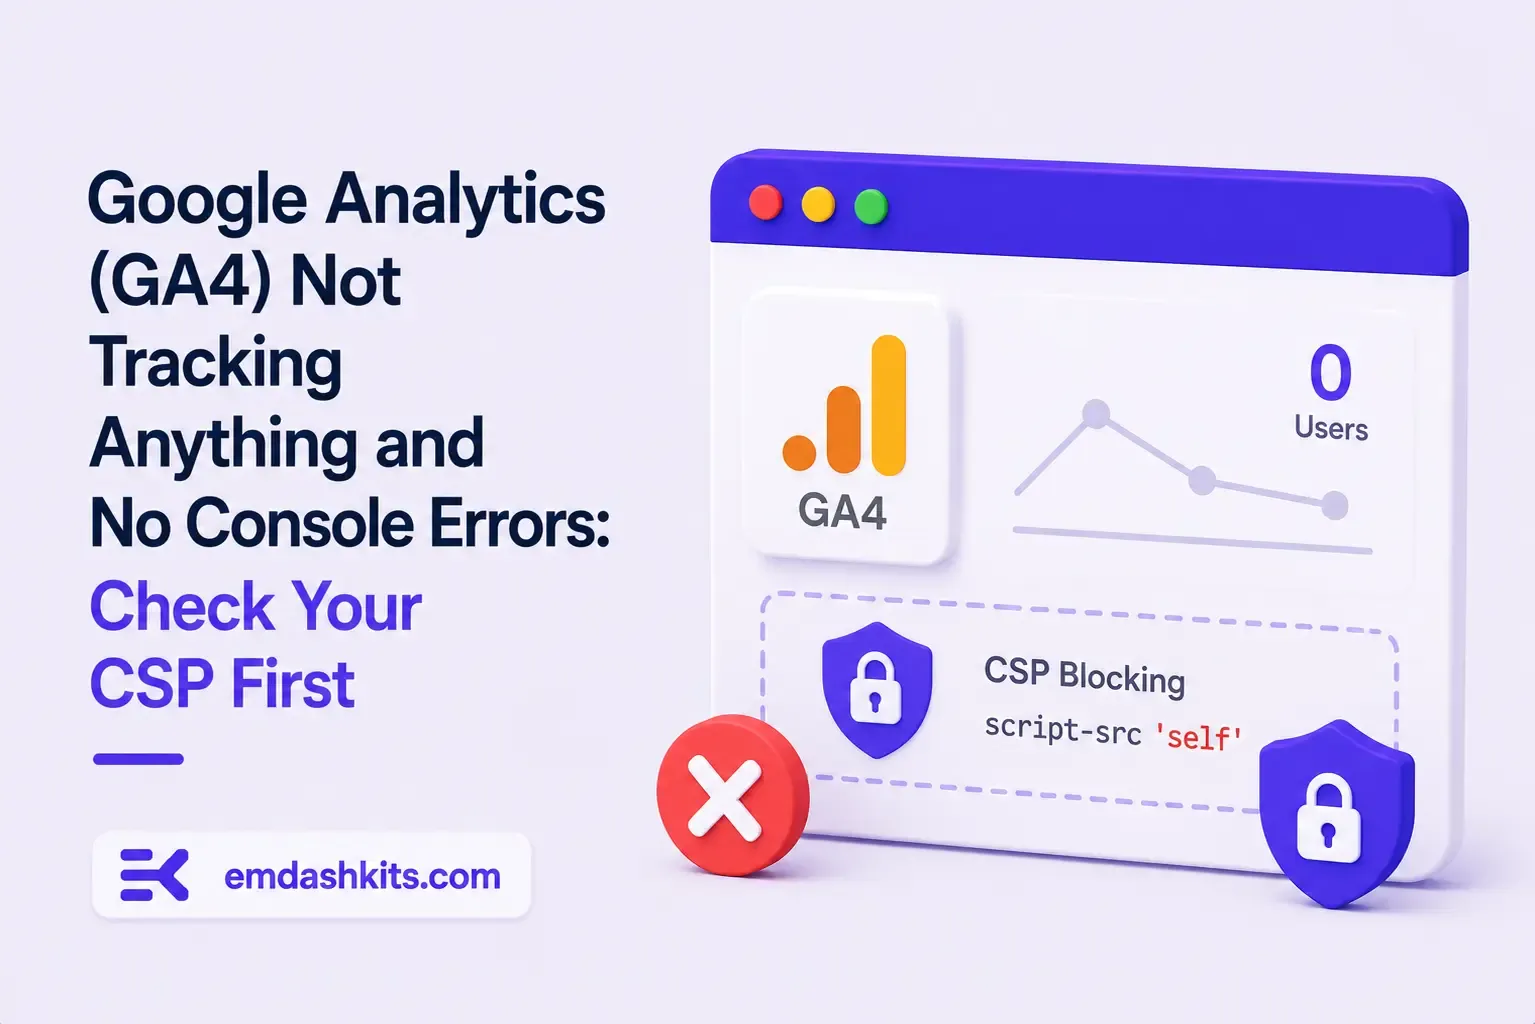
TL;DR — GA4's gtag.js snippet was installed correctly, the page loaded with no visible JavaScript error, and GA4's real-time report still showed zero activity. The CMS's default Content-Security-Policy had no allowance for analytics domains and no config option to add one — so every request to Google's tracking endpoints was blocked at the browser level before it could fail loudly.
Check the browser's dedicated CSP violation reporting, not the regular console error list — CSP blocks are reported through their own channel, not thrown as normal script errors, so "no console errors" doesn't mean nothing was blocked.
Root cause
The CSP's script-src and connect-src directives had no entry for googletagmanager.com or google-analytics.com, and the CMS exposed no configuration surface to add one — the only way in was patching the CSP directives directly.
// patch-package: add analytics domains to the existing CSP directives
scriptSrc.push("https://www.googletagmanager.com");
connectSrc.push("https://www.google-analytics.com", "https://www.googletagmanager.com");
"No console errors" is not proof nothing was blocked — CSP violations live in their own reporting surface and are easy to miss if you're only scanning for red error text.
Before adding any third-party script tag to a site with a CSP already in place, check the CSP's directives first rather than assuming a silently-empty analytics dashboard means a snippet-installation mistake.





Comments