TL;DR — A feature built on plain custom database tables threw "Body is unusable: Body has already been read" on request.json() every time a request's body, query, or path contained an ID that was valid and actually owned by the requesting user. The exact root cause was never found despite deep debugging. Switching the same data to be stored in a CMS content type table instead made the bug disappear entirely.
A link-in-bio feature for users authenticated through a separate custom session system (not the CMS's own admin accounts) was first built on two plain custom tables. All reads/writes went through hand-written API routes calling request.json() directly.
Symptom
Any request whose body, query string, or path parameter contained a valid ID that the current user actually owned failed with a body-already-read parsing error. Requests without such an ID, or with an ID the user didn't own, worked fine.
Moving the ID from the request body into the query string, then into the path
Encoding/decoding the value differently
None of it changed the behavior — strong evidence the bug wasn't really about the ID's shape or location, but about something deeper in how that specific table's data was flowing through the request pipeline.
The fix that actually worked
The feature's storage was migrated from the custom tables to the CMS's own content-type table (created through the CMS admin, giving an auto-generated ec_* table with the standard field editor). All ownership scoping was still handled manually outside the CMS's own auth (see the byline-bridge pattern for that), but the underlying storage changed from a hand-rolled table to a CMS-managed one. The parsing error never occurred again.
Lessons learned
The precise mechanism was never confirmed — this is an honest "the fix worked, the why remains unclear" writeup, not a definitive root-cause explanation.
If a project on a similar stack hits this exact symptom pattern (body-parse failure keyed specifically to a valid, owned ID) on a hand-rolled custom table, suspect this before spending a long time on HTTP-level debugging — moving the data into the CMS's own content-type storage is a cheap thing to try early.
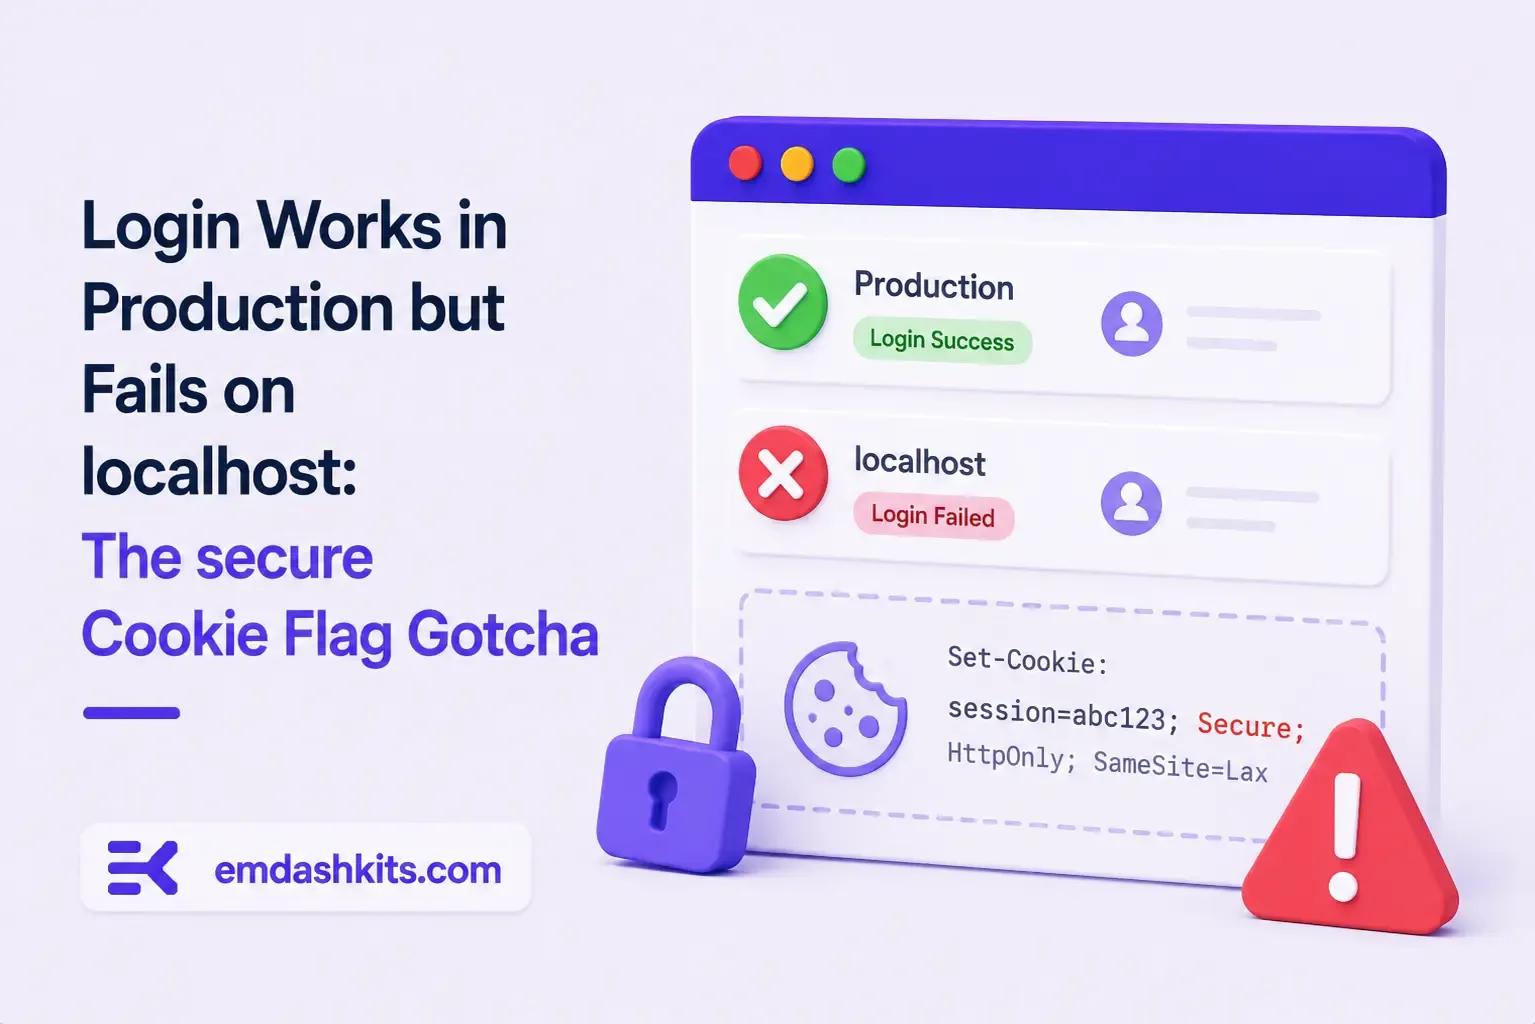
TL;DR — A custom session-cookie login flow appeared to succeed on localhost (the OTP verified, the response looked fine) but every subsequent request to a login-gated page treated the visitor as logged out. Identical code worked fine on the live HTTPS site. The cookie's Secure attribute was hardcoded to true — and per the cookie spec, browsers never store or send a Secure cookie over a plain, non-HTTPS connection.
Check the actual Set-Cookie response header and the browser's own cookie storage panel — on localhost over http://, the cookie is sent by the server but never actually stored by the browser.
Root cause
// before -- assumes the app is always served over HTTPS
setCookie("session", token, { secure: true, httpOnly: true });
emdashkits.com
A cookie config that quietly assumes "we're always on HTTPS" breaks the instant you test over plain HTTP, which local dev servers commonly are.
// after -- derive secure from the actual request protocol
const isHttps = request.url.startsWith("https://");
setCookie("session", token, { secure: isHttps, httpOnly: true });
emdashkits.com
Lessons learned
Any Secure-flagged cookie needs to key off the real request scheme, not an assumption baked in once at cookie-creation time.
"Works in production, silently fails in local dev" is a strong signal to check cookie flags before anything else in an auth flow.
Check other cookies in the same codebase for the same hardcoded assumption — if one cookie has this bug, sibling cookies set the same way are worth auditing too.
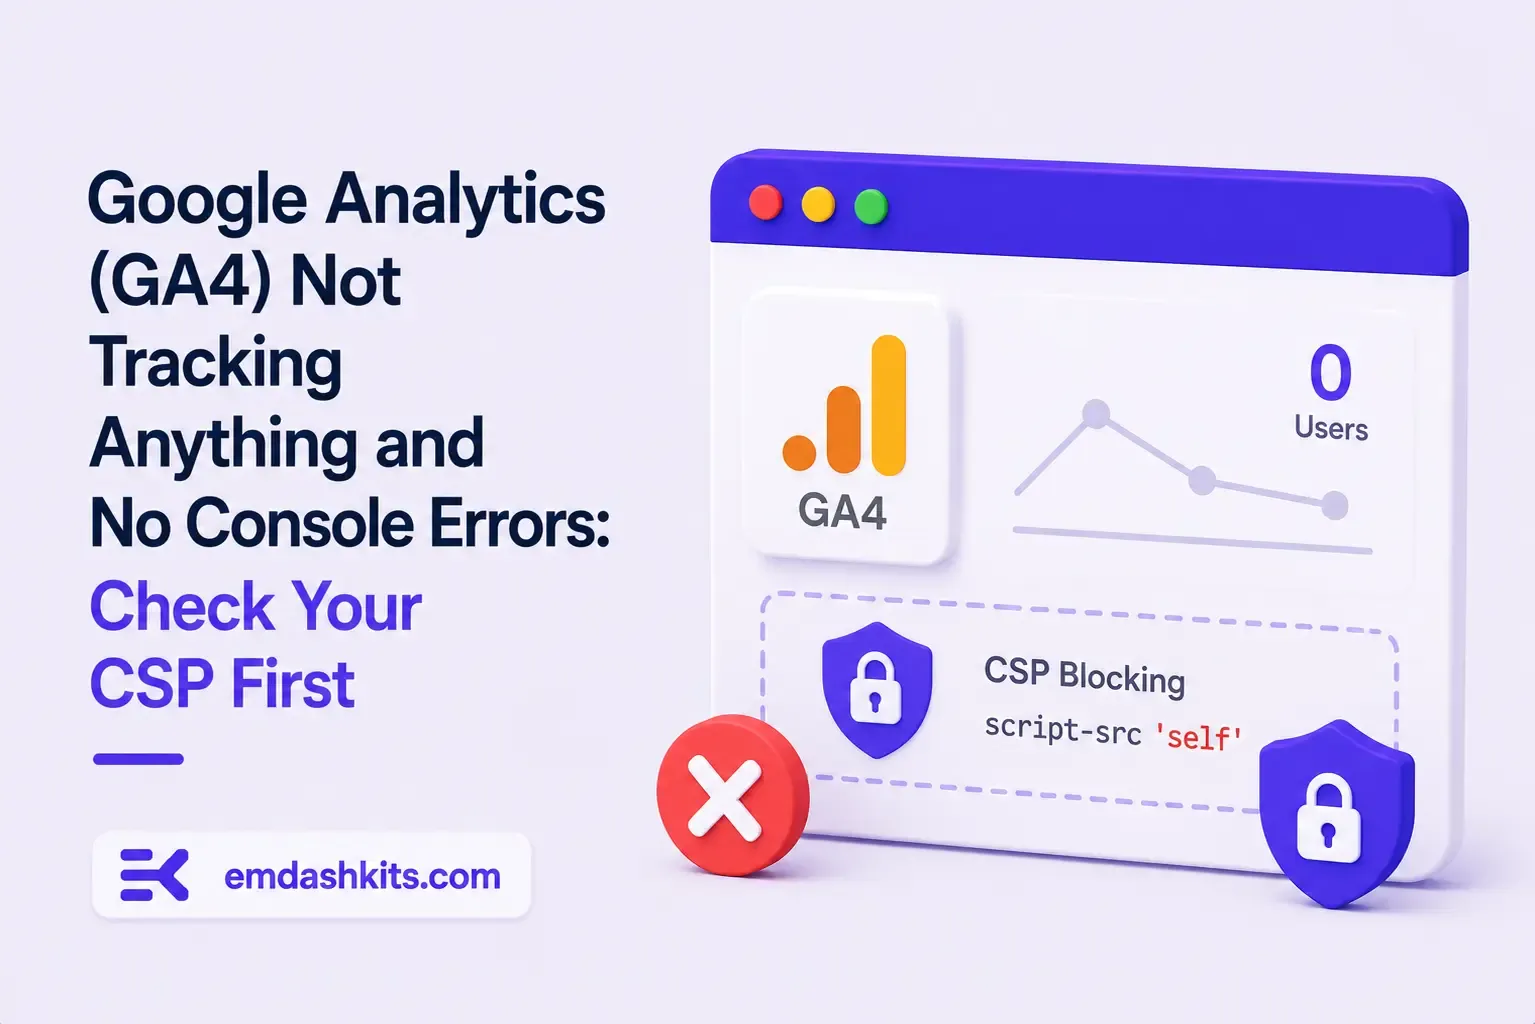
TL;DR — GA4's gtag.js snippet was installed correctly, the page loaded with no visible JavaScript error, and GA4's real-time report still showed zero activity. The CMS's default Content-Security-Policy had no allowance for analytics domains and no config option to add one — so every request to Google's tracking endpoints was blocked at the browser level before it could fail loudly.
Check the browser's dedicated CSP violation reporting, not the regular console error list — CSP blocks are reported through their own channel, not thrown as normal script errors, so "no console errors" doesn't mean nothing was blocked.
Root cause
The CSP's script-src and connect-src directives had no entry for googletagmanager.com or google-analytics.com, and the CMS exposed no configuration surface to add one — the only way in was patching the CSP directives directly.
// patch-package: add analytics domains to the existing CSP directives
scriptSrc.push("https://www.googletagmanager.com");
connectSrc.push("https://www.google-analytics.com", "https://www.googletagmanager.com");
"No console errors" is not proof nothing was blocked — CSP violations live in their own reporting surface and are easy to miss if you're only scanning for red error text.
Before adding any third-party script tag to a site with a CSP already in place, check the CSP's directives first rather than assuming a silently-empty analytics dashboard means a snippet-installation mistake.


Comments