How to Add a Blog to Your Website Using EmDash CMS

How to Add a Blog to Your Website Using EmDash CMS

An open laptop showing a blog writing interface

Adding a blog to an EmDash site is really two small pieces: a content model for posts, and two Astro pages to render them. This walks through both, starting from a blank EmDash project.

Table of Contents
  1. Step 1: Define the Posts Collection
  2. Step 2: Build the Blog Index Page
  3. Step 3: Build the Post Detail Page
  4. Step 4: Add Blog to Navigation
  5. Step 5: Write and Publish Your First Real Post
  6. Optional: Categories and Tags
  7. Frequently Asked Questions
  8. Do I need a separate collection for pages versus blog posts?
  9. Can editors write posts without any Astro or code knowledge?
  10. How do I handle a blog with hundreds of posts and pagination?
  11. Will new posts show up immediately, or do I need to redeploy?
  12. The Bottom Line

Step 1: Define the Posts Collection

If you scaffolded with the default starter, a `posts` collection likely already exists. If you're adding one from scratch, create it in the admin panel's Visual Schema Builder, or script it with the CLI:

npx emdash schema create posts --label Posts --label-singular Post --description "Blog posts"
npx emdash schema add-field posts excerpt --type text --label "Excerpt"
npx emdash schema add-field posts content --type portableText --label "Content" --required
npx emdash schema add-field posts featuredImage --type image --label "Featured Image"
emdashkits.com

A minimal blog post collection needs a title (most collections get one by default), a `slug` for the URL, a `portableText` field for the body, and usually a `text` excerpt and an `image` field for a featured image. Add a `reference` field to an `authors` collection if you want author bylines, or use EmDash's built-in byline system instead — see our guide on managing multiple authors for that.

Step 2: Build the Blog Index Page

---
// src/pages/blog/index.astro
import { getEmDashCollection } from "emdash";
import Base from "../../layouts/Base.astro";

const { entries: posts, error } = await getEmDashCollection("posts", {
  status: "published",
  orderBy: "published_at",
  order: "desc",
  limit: 20,
});

if (error) console.error("Failed to load posts:", error);
---

<Base title="Blog">
  <h1>Blog</h1>
  <ul>
    {posts.map((post) => (
      <li>
        <a href={`/blog/${post.slug}`}>{post.data.title}</a>
        {post.data.excerpt && <p>{post.data.excerpt}</p>}
      </li>
    ))}
  </ul>
</Base>
emdashkits.com

Filtering by `status: "published"` is the important part — without it, you'd render drafts on the public listing. `getEmDashCollection` accepts `orderBy`, `order`, and `limit` directly, so pagination and sorting don't need a manual sort step in your template.

Read also:

Step 3: Build the Post Detail Page

---
// src/pages/blog/[slug].astro
import { getEmDashEntry } from "emdash";
import { PortableText } from "emdash/ui";
import Base from "../../layouts/Base.astro";

const { slug } = Astro.params;
const { entry: post, error } = await getEmDashEntry("posts", slug);

if (!post) {
  return Astro.redirect("/404");
}
---

<Base title={post.data.title}>
  <article>
    <h1>{post.data.title}</h1>
    <PortableText value={post.data.content} />
  </article>
</Base>
emdashkits.com

`getEmDashEntry` automatically serves the published version on the live site, and — if the request carries a valid signed preview token — the current draft instead, with no extra logic in your template. That's what makes EmDash's preview system "implicit": the same page code works for both live traffic and an editor previewing an unpublished draft.

Step 4: Add Blog to Navigation

Link it into your site's primary menu from the admin panel, or via the CLI:

npx emdash menu get primary
# then edit via the admin UI at /_emdash/admin/menus,
# or update programmatically through the REST API
emdashkits.com

Step 5: Write and Publish Your First Real Post

  1. In the admin, go to Posts → New Post.
  2. Fill in the title, excerpt, and write the body in the rich text editor.
  3. Upload a featured image directly from the editor's media picker if you added that field.
  4. Set status to Published, and save.

Your post is live immediately at `/blog/your-post-slug` — no rebuild step.

Optional: Categories and Tags

For a blog with more than a handful of posts, taxonomies make the listing page genuinely useful. Add categories via the CLI or admin:

npx emdash taxonomy add-term categories --name "Product Updates" --slug product-updates
npx emdash taxonomy add-term categories --name "Engineering" --slug engineering
emdashkits.com

Then build a `/blog/category/[slug].astro` page filtering `getEmDashCollection("posts", { where: { category: slug } })` the same way the main blog index does, just scoped to one term.

Frequently Asked Questions

Do I need a separate collection for pages versus blog posts?

Generally yes — a `pages` collection for static content (About, Contact) and a `posts` collection for the blog keeps each content type's fields relevant to what it actually needs, rather than one bloated collection with fields only some entries use.

Can editors write posts without any Astro or code knowledge?

Yes — once the collection and templates exist, an editor works entirely in the rich text admin editor. They never touch the Astro pages that render their content.

How do I handle a blog with hundreds of posts and pagination?

Use `getEmDashCollection`'s `limit` and `cursor`-based pagination (from the query response) to build page 2, 3, and so on, rather than loading every post on one index page.

Will new posts show up immediately, or do I need to redeploy?

Immediately — EmDash serves content through Astro's Live Content Collections at runtime, so a newly published post appears on the live blog index without a rebuild or redeploy.

The Bottom Line

A working, editor-friendly blog on EmDash is one collection and two Astro templates — no separate CMS backend, no rebuild step between publishing and it going live. From here, see our guide to customizing content models further if you want richer post fields, or optimizing the result for SEO.
Share

Comments

Write a comment

Related Articles

Login Works in Production but Fails on localhost: The secure Cookie Flag Gotcha

July 16, 2026

Login Works in Production but Fails on localhost: The secure Cookie Flag Gotcha

Google Analytics (GA4) Not Tracking Anything and No Console Errors: Check Your CSP First

July 16, 2026

Google Analytics (GA4) Not Tracking Anything and No Console Errors: Check Your CSP First

Native Module Build Fails on Shared Hosting (node-gyp, Old glibc/Python): The .npmrc Fix

July 16, 2026

Native Module Build Fails on Shared Hosting (node-gyp, Old glibc/Python): The .npmrc Fix

Login Works in Production but Fails on localhost: The secure Cookie Flag Gotcha

Login Works in Production but Fails on localhost: The secure Cookie Flag Gotcha

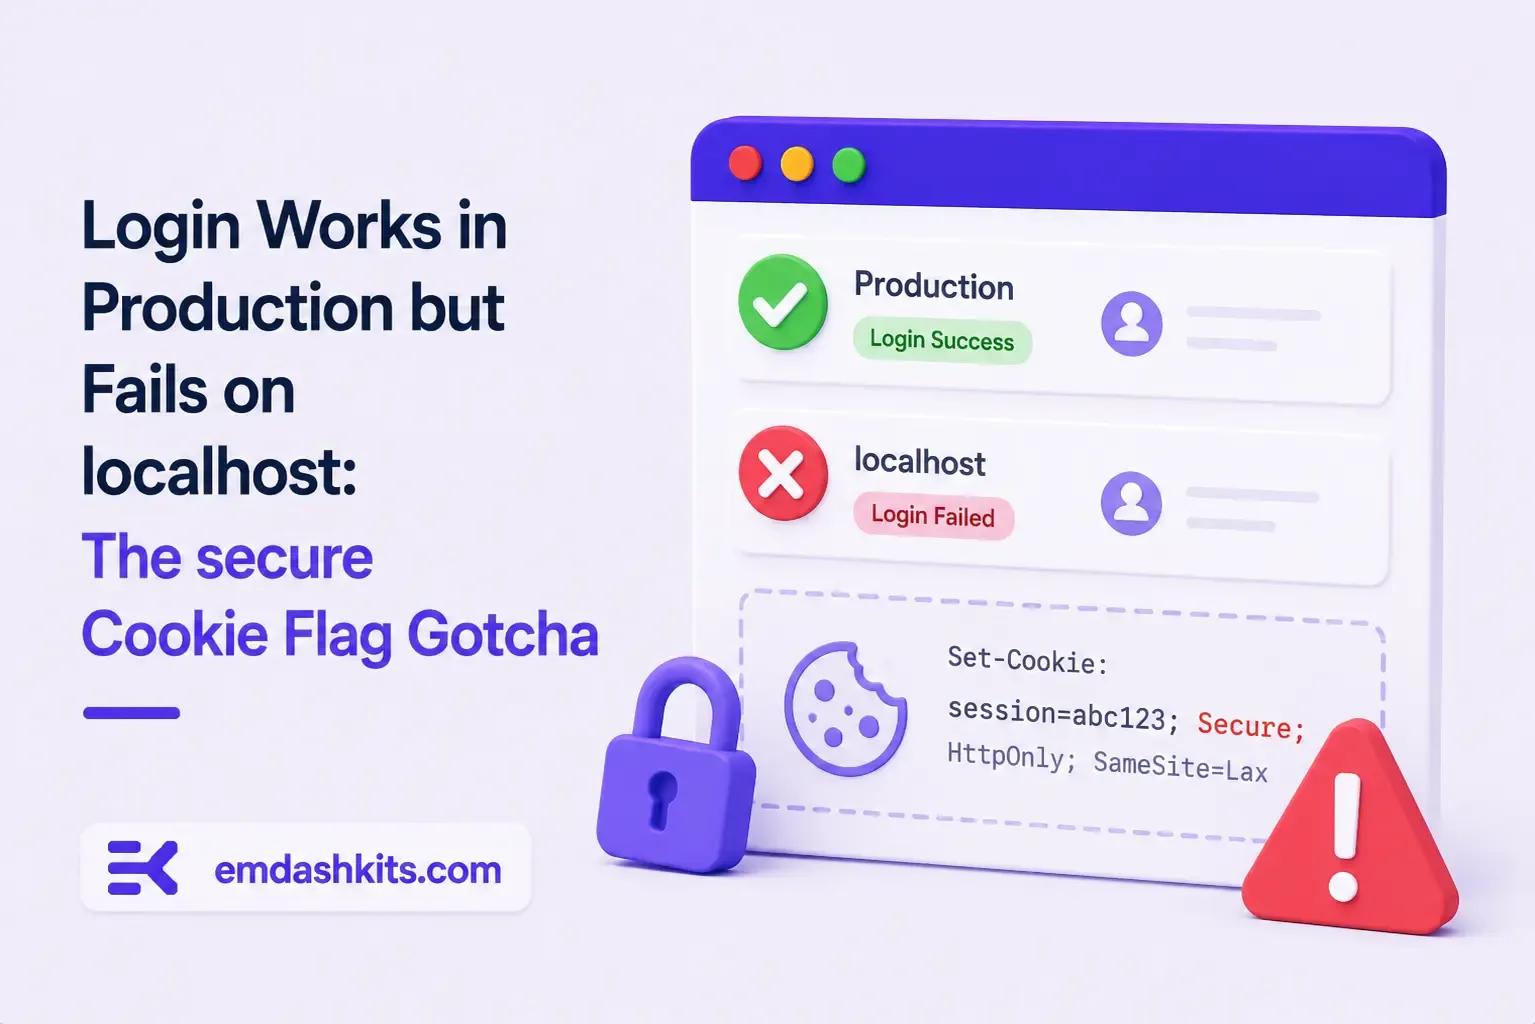
TL;DR — A custom session-cookie login flow appeared to succeed on localhost (the OTP verified, the response looked fine) but every subsequent request to a login-gated page treated the visitor as logged out. Identical code worked fine on the live HTTPS site. The cookie's Secure attribute was hardcoded to true — and per the cookie spec, browsers never store or send a Secure cookie over a plain, non-HTTPS connection.

Table of Contents
  1. Diagnostic
  2. Root cause
  3. Fix
  4. Lessons learned

Diagnostic

Check the actual Set-Cookie response header and the browser's own cookie storage panel — on localhost over http://, the cookie is sent by the server but never actually stored by the browser.

Root cause

// before -- assumes the app is always served over HTTPS
setCookie("session", token, { secure: true, httpOnly: true });
emdashkits.com

A cookie config that quietly assumes "we're always on HTTPS" breaks the instant you test over plain HTTP, which local dev servers commonly are.

Read also:

Fix

// after -- derive secure from the actual request protocol
const isHttps = request.url.startsWith("https://");
setCookie("session", token, { secure: isHttps, httpOnly: true });
emdashkits.com

Lessons learned

  • Any Secure-flagged cookie needs to key off the real request scheme, not an assumption baked in once at cookie-creation time.
  • "Works in production, silently fails in local dev" is a strong signal to check cookie flags before anything else in an auth flow.
  • Check other cookies in the same codebase for the same hardcoded assumption — if one cookie has this bug, sibling cookies set the same way are worth auditing too.
Share
Previous Article

Google Analytics (GA4) Not Tracking Anything and No Console Errors: Check Your CSP First

Comments

Write a comment

Related Articles

Google Analytics (GA4) Not Tracking Anything and No Console Errors: Check Your CSP First

July 16, 2026

Google Analytics (GA4) Not Tracking Anything and No Console Errors: Check Your CSP First

Native Module Build Fails on Shared Hosting (node-gyp, Old glibc/Python): The .npmrc Fix

July 16, 2026

Native Module Build Fails on Shared Hosting (node-gyp, Old glibc/Python): The .npmrc Fix

Uploaded Images Disappear After Every Deploy on Shared Hosting (and Other Reverse-Proxy Gotchas)

July 16, 2026

Uploaded Images Disappear After Every Deploy on Shared Hosting (and Other Reverse-Proxy Gotchas)

Google Analytics (GA4) Not Tracking Anything and No Console Errors: Check Your CSP First

Google Analytics (GA4) Not Tracking Anything and No Console Errors: Check Your CSP First

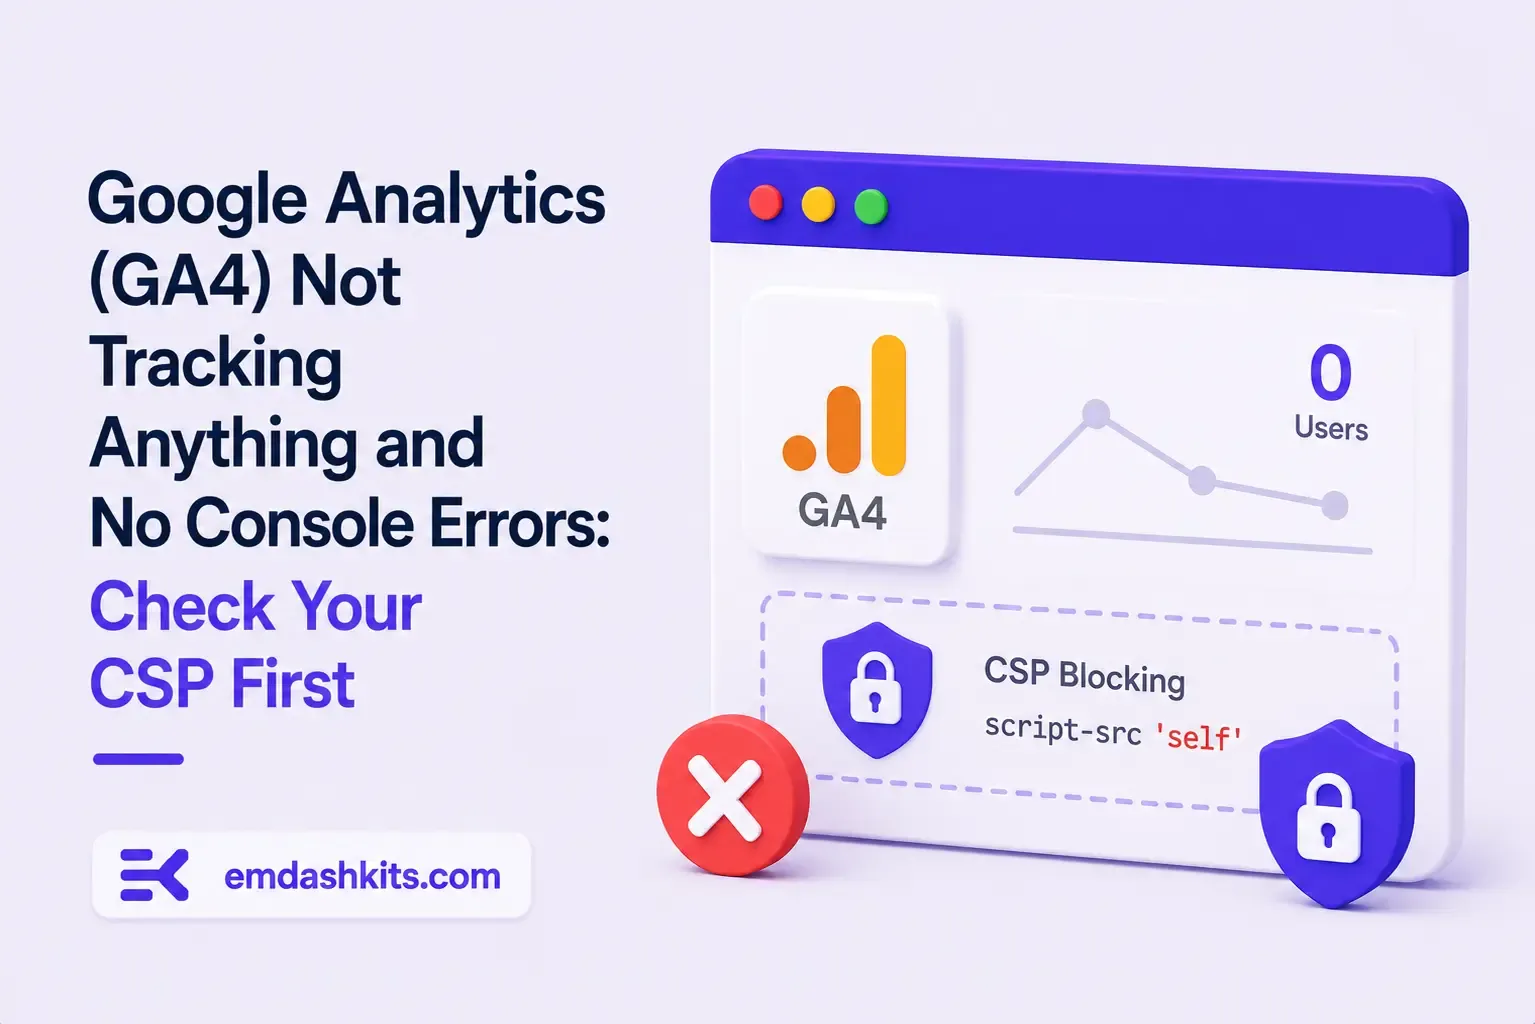
TL;DR — GA4's gtag.js snippet was installed correctly, the page loaded with no visible JavaScript error, and GA4's real-time report still showed zero activity. The CMS's default Content-Security-Policy had no allowance for analytics domains and no config option to add one — so every request to Google's tracking endpoints was blocked at the browser level before it could fail loudly.

Table of Contents
  1. Diagnostic
  2. Root cause
  3. Lessons learned

Diagnostic

Check the browser's dedicated CSP violation reporting, not the regular console error list — CSP blocks are reported through their own channel, not thrown as normal script errors, so "no console errors" doesn't mean nothing was blocked.

Root cause

The CSP's script-src and connect-src directives had no entry for googletagmanager.com or google-analytics.com, and the CMS exposed no configuration surface to add one — the only way in was patching the CSP directives directly.

// patch-package: add analytics domains to the existing CSP directives
scriptSrc.push("https://www.googletagmanager.com");
connectSrc.push("https://www.google-analytics.com", "https://www.googletagmanager.com");
emdashkits.com
Read also:

Lessons learned

  • "No console errors" is not proof nothing was blocked — CSP violations live in their own reporting surface and are easy to miss if you're only scanning for red error text.
  • Before adding any third-party script tag to a site with a CSP already in place, check the CSP's directives first rather than assuming a silently-empty analytics dashboard means a snippet-installation mistake.
Share
Previous Article

Native Module Build Fails on Shared Hosting (node-gyp, Old glibc/Python): The .npmrc Fix

Next Article

Login Works in Production but Fails on localhost: The secure Cookie Flag Gotcha

Comments

Write a comment

Related Articles

Login Works in Production but Fails on localhost: The secure Cookie Flag Gotcha

July 16, 2026

Login Works in Production but Fails on localhost: The secure Cookie Flag Gotcha

Native Module Build Fails on Shared Hosting (node-gyp, Old glibc/Python): The .npmrc Fix

July 16, 2026

Native Module Build Fails on Shared Hosting (node-gyp, Old glibc/Python): The .npmrc Fix

Uploaded Images Disappear After Every Deploy on Shared Hosting (and Other Reverse-Proxy Gotchas)

July 16, 2026

Uploaded Images Disappear After Every Deploy on Shared Hosting (and Other Reverse-Proxy Gotchas)