TL;DR — On a bilingual EmDash + Astro site, the language-switcher dropdown failed to appear even though a published translation existed. The cause: calling the translation lookup with entry.id instead of entry.data.id. For this content collection, entry.id is the slug — and an EN/ID post pair can legitimately share the same slug — so a slug-keyed lookup with no locale context can silently resolve the wrong row.
A post has a confirmed, published translation in the other locale (verified directly in the database).
The globe-icon language switcher in the header doesn't render on that post's page at all.
Other posts with translations show the switcher correctly — the failure is per-post, not site-wide.
The wrong call
const languageLinks = await getTranslations("posts", entry.id);
// entry.id is the Astro-collection id, which equals the slug for this
// content type -- not the row's real per-locale ULID.
Every content entry has two different identifiers that are easy to confuse: entry.id (the Astro content-collection identity, which for this project's post schema is the slug) and entry.data.id (the real, per-locale-unique database ULID). Passing the slug into a translation lookup is ambiguous whenever both locale versions can share that slug — the lookup can match the wrong row, or match nothing, and the switcher just silently doesn't render.
The fix
const languageLinks = await getTranslations("posts", entry.data.id);
// entry.data.id is the ULID stored on the row itself -- unambiguous
// regardless of what the slug happens to be in either locale.
emdashkits.com
Lessons learned
Treat a content collection's entry.id as a routing detail, not a stable identifier to pass into other lookups.
Anywhere translation/relation lookups are wired up, always reach for the row's own ULID field, never the collection's derived id.
This bug produces no error — it fails by simply not rendering something. Test the specific post you just translated, not just "a" post, before trusting the feature works.
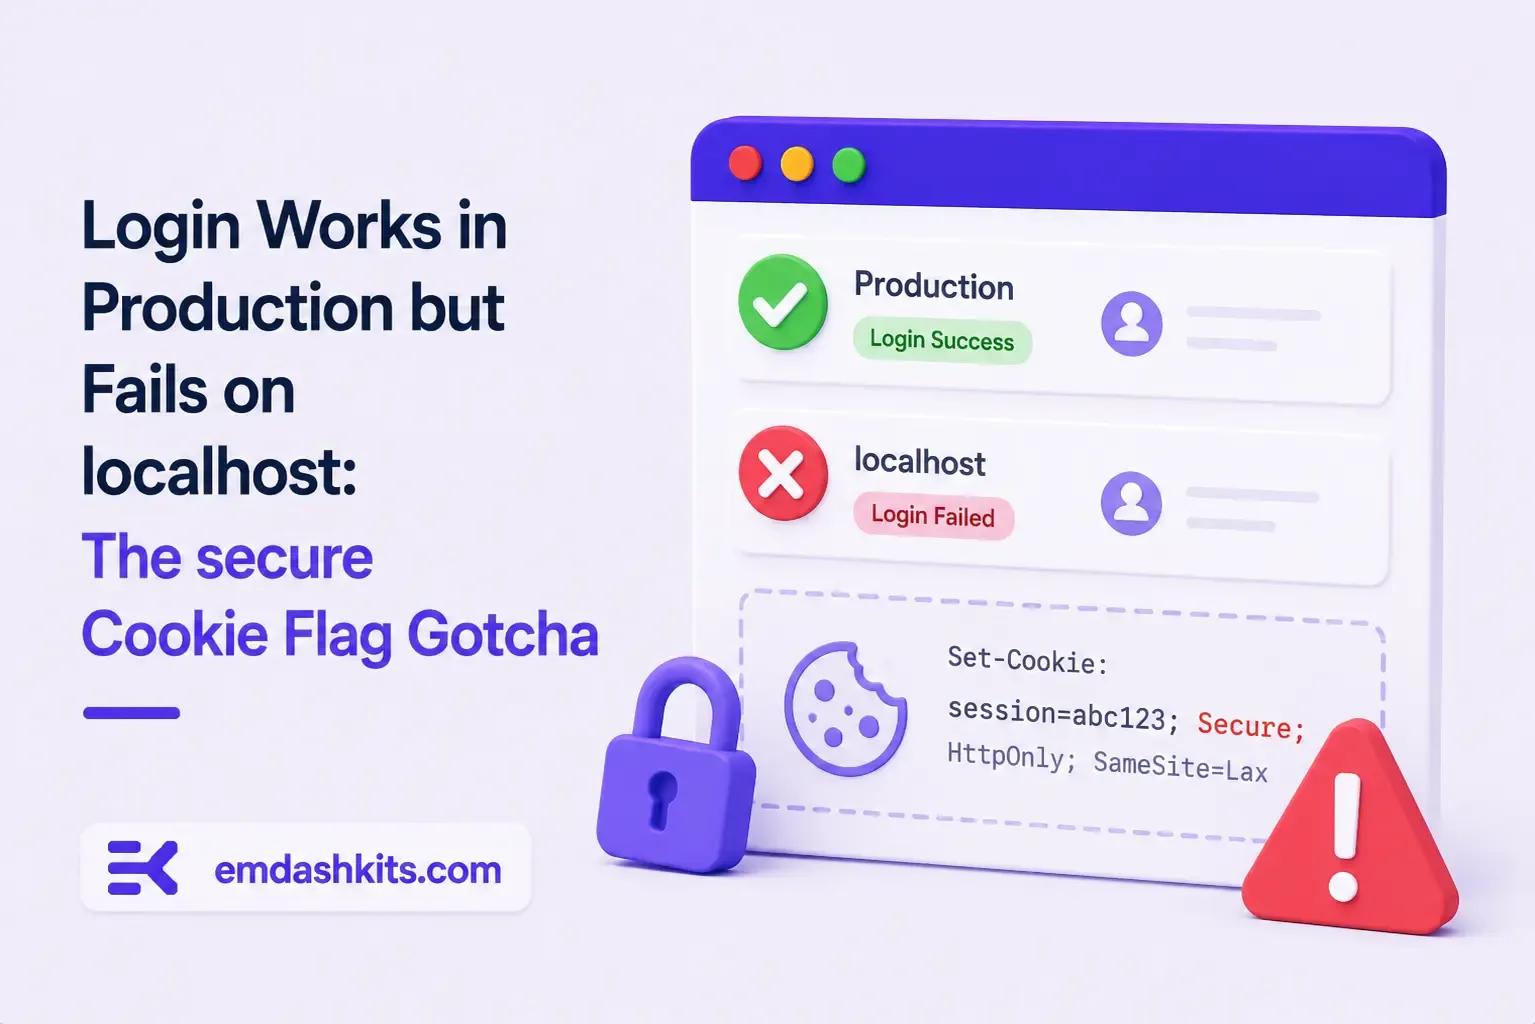
TL;DR — A custom session-cookie login flow appeared to succeed on localhost (the OTP verified, the response looked fine) but every subsequent request to a login-gated page treated the visitor as logged out. Identical code worked fine on the live HTTPS site. The cookie's Secure attribute was hardcoded to true — and per the cookie spec, browsers never store or send a Secure cookie over a plain, non-HTTPS connection.
Check the actual Set-Cookie response header and the browser's own cookie storage panel — on localhost over http://, the cookie is sent by the server but never actually stored by the browser.
Root cause
// before -- assumes the app is always served over HTTPS
setCookie("session", token, { secure: true, httpOnly: true });
emdashkits.com
A cookie config that quietly assumes "we're always on HTTPS" breaks the instant you test over plain HTTP, which local dev servers commonly are.
// after -- derive secure from the actual request protocol
const isHttps = request.url.startsWith("https://");
setCookie("session", token, { secure: isHttps, httpOnly: true });
emdashkits.com
Lessons learned
Any Secure-flagged cookie needs to key off the real request scheme, not an assumption baked in once at cookie-creation time.
"Works in production, silently fails in local dev" is a strong signal to check cookie flags before anything else in an auth flow.
Check other cookies in the same codebase for the same hardcoded assumption — if one cookie has this bug, sibling cookies set the same way are worth auditing too.
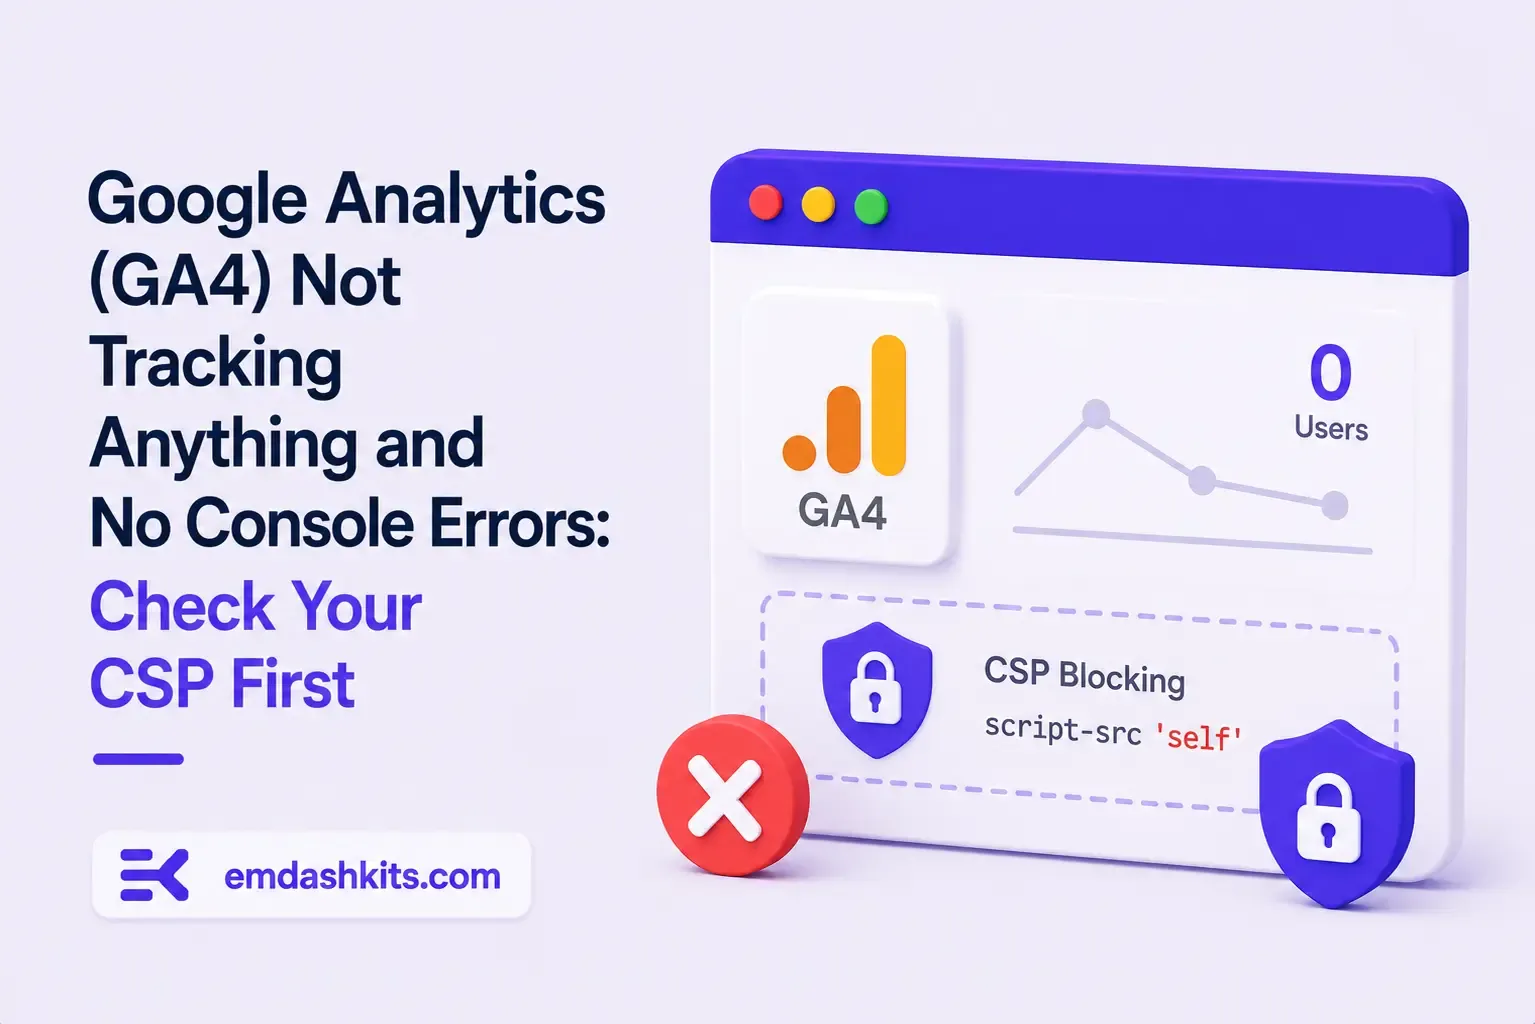
TL;DR — GA4's gtag.js snippet was installed correctly, the page loaded with no visible JavaScript error, and GA4's real-time report still showed zero activity. The CMS's default Content-Security-Policy had no allowance for analytics domains and no config option to add one — so every request to Google's tracking endpoints was blocked at the browser level before it could fail loudly.
Check the browser's dedicated CSP violation reporting, not the regular console error list — CSP blocks are reported through their own channel, not thrown as normal script errors, so "no console errors" doesn't mean nothing was blocked.
Root cause
The CSP's script-src and connect-src directives had no entry for googletagmanager.com or google-analytics.com, and the CMS exposed no configuration surface to add one — the only way in was patching the CSP directives directly.
// patch-package: add analytics domains to the existing CSP directives
scriptSrc.push("https://www.googletagmanager.com");
connectSrc.push("https://www.google-analytics.com", "https://www.googletagmanager.com");
"No console errors" is not proof nothing was blocked — CSP violations live in their own reporting surface and are easy to miss if you're only scanning for red error text.
Before adding any third-party script tag to a site with a CSP already in place, check the CSP's directives first rather than assuming a silently-empty analytics dashboard means a snippet-installation mistake.


Comments